How StackOverflowException can bring down an expensive compute cluster
In my previous post I talked about the
dangers of StackOverflowException. I also promised to show you how denial of service looks like in real world.
Today, I’m delivering on that promise! Let’s start by answering the fundamental question: how does a process
crash lead to denial of service in the first place?
Theoretical explanation
Suppose you are running an HTTP web service and an attacker sends you a payload that will crash your server process. What happens next?
First of all, crashing the server process will also terminate all in-flight HTTP requests, which obviously means the clients will be disconnected and won’t get any response. More importantly, you can’t instantaneously replace the old, dead process—it’s very likely that the new process will need at least a few seconds to initialize. During this period your service is as good as dead, because there is nothing handling the incoming HTTP requests. What happens when the process is finally ready? Some lucky requests might complete successfully (although with high latency, because they were waiting for the server to restart), but the next malicious request is going to kill the process again, and the whole dance repeats.
You might say “Meh, I have a massive fleet of virtual machines, no one can hurt me. If a single instance goes down, my load balancer will just take it out of rotation—healthy instances will continue to handle the traffic.” Well, the load balancer will indeed send traffic only to healthy instances, but this also means they’ll be up for grabs: attacker can easily bring all your machines down one by one and keep them in the infinite process restart loop.
But all this is just a theory. Is it really that easy to bring a big cluster of virtual machines down to its knees? Let’s find out!
The setup
We need three basic components to perform a proper denial of service attack:
- Vulnerable service running on multiple machines
- Load test to simulate the real users
- Attacker sending the malicious requests
Let’s describe each of these in more detail.
1. Vulnerable service
We want to match the real-world conditions, which means that our service should run on multiple instances behind the load balancer (it’s technically possible to perform the attack against a single virtual machine, but that wouldn’t be particularly fun or impressive—the goal of this post is to kill a large-scale service). My compute technology of choice was Azure Functions, mainly because I already knew how to use Azure Functions (also, I would rather blow my brains out than try to set up a Kubernetes cluster). Instead of using the default Consumption plan, which adds or removes instances based on the number of incoming requests, I decided to use the Premium plan. I though the Premium plan would be a better fit because:
- It eliminates cold starts with always ready instances, making the simulation more predictable.
- If offers more instance types (the more powerful the machines are, the more embarrassing their
downfall would be). My choice was, of course, the most expensive one:
Elastic Premium EP3, with 840 total ACU (whatever the hell that means).
For the cluster size, ten instances seemed good enough—reasonably big to show the impact on a real production cluster, but not too big to surprise me with a massive Azure bill. Estimated cost: 5,200 EUR/month. Of course, I’m not crazy, and I didn’t keep this whole setup for the whole month (and at 7 EUR/hour, I had to run my experiments pretty efficiently).
2. Load test
Before looking at how denial of service attack degrades the user experience, we need to determine what’s
the expected service performance. We don’t have real users, but we do have load tests, and my load testing
tool of choice was wrk2. It’s easy to use (I dare you to try using
Gatling), produces constant throughput load, and accurately measures
latency percentiles. If you want to learn more about why I chose wrk2, you can watch one of my favorite
talks ever: How NOT to Measure Latency (if you haven’t
watched it yet, please do it right now, I’ll wait—it’s way more important than this blog post anyway).
I wanted to use a dedicated virtual machine for load testing, so I selected Standard_D16s_v5 (16 VCPUS, 64 GiB memory), the largest instance type available without requesting a quota increase.
3. Attacker
We have the service and we have the users—the final piece of the puzzle is to ruin their experience. This was the easiest part of the whole setup: I just had to repeatedly crash the service with malicious requests. I didn’t want to send too many requests (just to prove that you don’t need crazy computational power or network bandwidth), so I decided to send one request every millisecond. The code itself is nothing fancy, but if you are interested, it’s available here.
Load testing the healthy function
Now that all the components are ready, it’s time to establish our baseline: how much traffic can the healthy
cluster handle? I didn’t know what’s the best way to choose the values of wrk2 parameters, so I just played
with all of them until I settled on 16 threads and 256 open HTTP connections. I wanted each instance to be able
to process at least 1,000 requests per second (pretty arbitrary and not something to brag about, but good enough
for the purposes of this blog post), so I configured wrk2 with the constant throughput of 10,000 requests per
second. Here are the results:
wrk -t16 -c256 -d600 -R10000 -L -v $url

 Latency Distribution (HdrHistogram - Recorded Latency)
 50.000%   13.56ms
 75.000%   15.33ms
 90.000%   18.75ms
 99.000%   41.22ms
 99.900%  123.46ms
 99.990%  270.85ms
 99.999%  358.40ms
100.000%  523.52ms

  5997762 requests in 10.00m, 817.95MB read
Requests/sec:   9996.22
Transfer/sec:      1.36MB

P99 was 41ms, and even the slowest request took only half a second, so I declared victory: the cluster was successfully handling 10,000 requests per second, officially joining the web scale club. Nowadays, it’s also popular to artificially inflate the traffic numbers by showing them as a number of monthly requests, so I’ll do that, too: my service could handle 25.92 billion HMR (hypothetical monthly requests)!
Denial of service
Now the real fun begins: let’s add the attacker to the story. Users are still calling the service at the same rate (10,000 requests per second), but the attacker is now joining them with 1,000 malicious requests every second (at a constant rate of one request every millisecond). How will that affect our cluster and the overall user experience?
wrk -t16 -c256 -d600 -R10000 -L -v $url

  6947 requests in 30.10s, 1.00MB read
  Socket errors: connect 0, read 0, write 0, timeout 3197
  Non-2xx or 3xx responses: 4248
Requests/sec:    230.83
Transfer/sec:     34.04KB
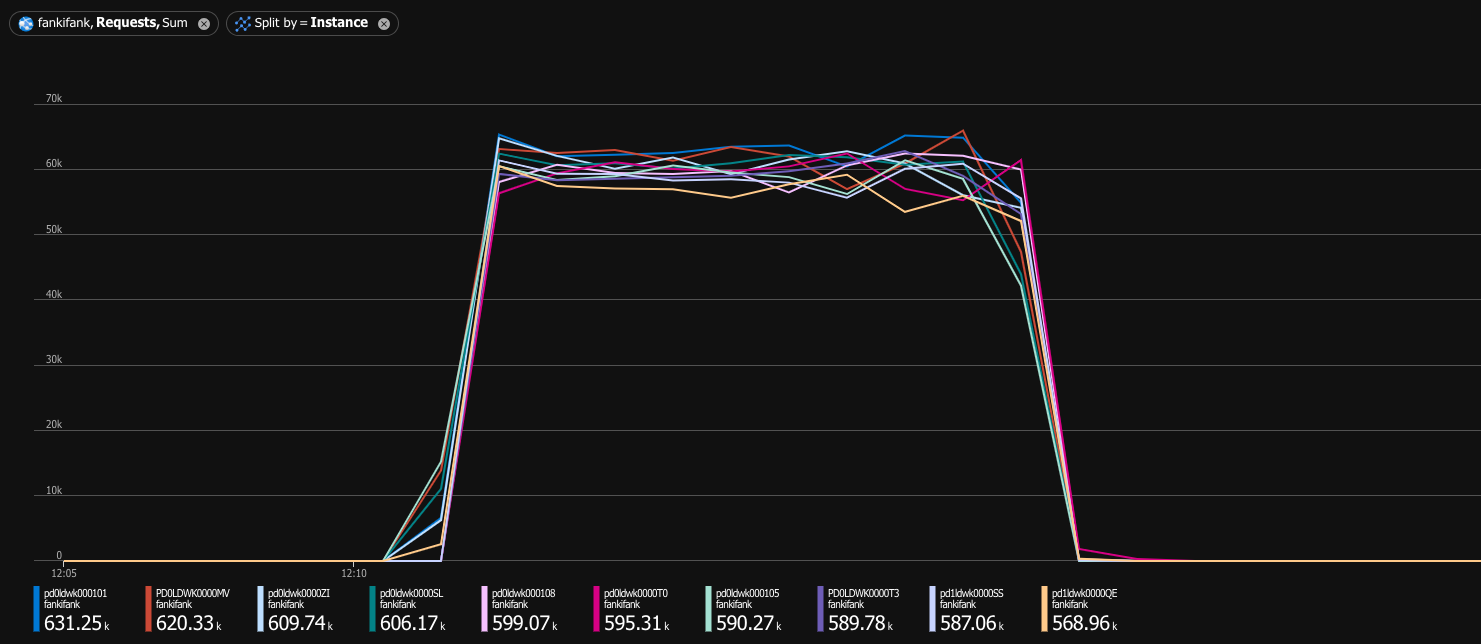
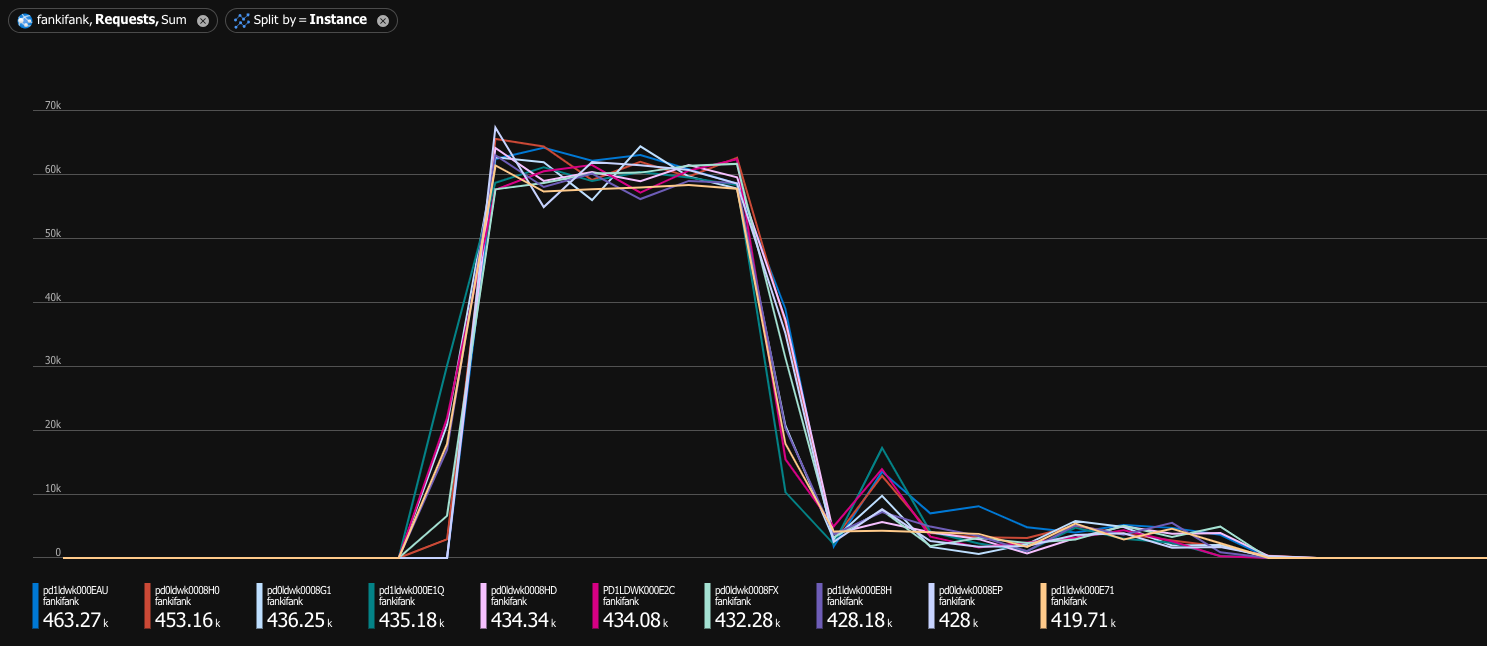
Oops. Healthy cluster was capable of handling 10,000 requests per second. Under denial of service attack, it could barely handle 230 requests per second. If you are a visual person, I have a game just for you—let’s play Spot the denial of service attack™:

You still might say “230 requests per second is still better than nothing.” Is it really? Let’s check the latency distribution:
  Latency Distribution (HdrHistogram - Recorded Latency)
 50.000%   16.32s
 75.000%   20.58s
 90.000%   21.87s
 99.000%   27.33s
 99.900%   27.80s
 99.990%   28.05s
 99.999%   28.67s
100.000%   28.67s

  Detailed Percentile spectrum:
       Value   Percentile   TotalCount 1/(1-Percentile)
    8863.743     0.000000            1         1.00
   13172.735     0.100000          677         1.11
   14704.639     0.200000         1359         1.25
   15253.503     0.300000         2031         1.43
   15671.295     0.400000         2707         1.67
   16318.463     0.500000         3385         2.00
Ouch. For 90% of successful requests, latency exceeded 13 seconds. Not only that, but the fastest request took almost 9 seconds! Our 5,200 EUR/month cluster, previously capable of handling at least 10,000 requests per second, has now been rendered completely useless.
Conclusion
If you are deserializing user-controlled data using a library vulnerable to StackOverflowException,
nothing can stop malicious users from bringing down your expensive compute cluster. To make matters worse,
my experiments show only the best-case scenario: my service didn’t have any initialization code, so every
process restart was relatively fast. In real world, you are most likely initializing database connections,
loading configuration files, and doing many other things that take time. All of this would make denial of
service worse and slow down the recovery even further.
I hope you enjoyed my most expensive post ever (my Azure bill for the last month was 66 EUR)! I still haven’t finished exploring the topic of stack overflow, so stay tuned for more posts in this series.