Exploring .NET Core platform intrinsics: Part 3 - Viewing the code generated by the JIT
Previous posts in the series:
- Exploring .NET Core platform intrinsics: Part 1 - Accelerating SHA-256 on ARMv8
- Exploring .NET Core platform intrinsics: Part 2 - Accelerating AES encryption on ARMv8
You’ve written some code using the new platform intrinsics API, but it’s not performing as great as you have expected, thus making you sad. Or maybe your code is really fast, but you still want to have a better understanding of how high-level APIs translate to machine code. In both cases, you will want to examine the assembly code generated by the JIT. This post will walk you through some of the ways to achieve that.
The code
Let’s start by writing the code that we will analyze later. MaxFast is a very simple function that calculates the maximum of an array of integers:
public static unsafe int MaxFast(int[] source)
{
  const int VectorSizeInInts = 8;

  var pos = 0;
  var max = Avx.SetAllVector256(Int32.MinValue);

  fixed (int* ptr = &source[0])
  {
    for (; pos <= source.Length - VectorSizeInInts; pos += VectorSizeInInts)
    {
      var current = Avx.LoadVector256(ptr + pos);
      max = Avx2.Max(current, max);
    }
  }

  var temp = stackalloc int[VectorSizeInInts];
  Avx.Store(temp, max);

  var max1 = MaxSlow(new ReadOnlySpan<int>(temp, VectorSizeInInts));
  var max2 = MaxSlow(source.AsSpan(pos));

  return Math.Max(max1, max2);
}

[MethodImpl(MethodImplOptions.NoInlining)]
private static int MaxSlow(ReadOnlySpan<int> source)
{
  int max = Int32.MinValue;

  for (int i = 0; i < source.Length; ++i)
  {
    if (source[i] > max)
    {
      max = source[i];
    }
  }

  return max;
}
It should be pretty obvious what the code above is doing, but if you have trouble following it, you might consider revisiting previous posts in this series, or take a look at the Intrinsics Playground repository (which is highly recommended anyway).
We want the JIT to generate the optimized code for us, so we are going to run our program in the release mode. We also want to have a nice debugging experience (with mapping between source code lines and assembly instructions), which is why we will need to add these two lines to our project file:
<DebugType>pdbonly</DebugType>
<DebugSymbols>true</DebugSymbols>
AVX intrinsics
Our code is using three intrinsic functions: Avx.SetAllVector256, Avx.LoadVector256, and Avx2.Max. How do we know which hardware instructions should be issued by the JIT for these functions? Documentation comments in Avx.cs and Avx2.cs files in the CoreCLR repository have all the answers:
public static class Avx
{
  /// <summary>
  /// __m256i _mm256_set1_epi8 (char a)
  ///   HELPER
  /// __m256i _mm256_set1_epi16 (short a)
  ///   HELPER
  /// __m256i _mm256_set1_epi32 (int a)
  ///   HELPER
  /// __m256i _mm256_set1_epi64x (long long a)
  ///   HELPER
  /// __m256 _mm256_set1_ps (float a)
  ///   HELPER
  /// __m256d _mm256_set1_pd (double a)
  ///   HELPER
  /// </summary>
  public static Vector256<T> SetAllVector256<T>(T value);

  /// <summary>
  /// __m256i _mm256_loadu_si256 (__m256i const * mem_addr)
  ///   VMOVDQU ymm, m256
  /// </summary>
  public static unsafe Vector256<int> LoadVector256(int* address);

  /// <summary>
  /// void _mm256_storeu_si256 (__m256i * mem_addr, __m256i a)
  ///   MOVDQU m256, ymm
  /// </summary>
  public static unsafe void Store(int* address, Vector256<int> source);
}

public static class Avx2
{
  /// <summary>
  /// __m256i _mm256_max_epi32 (__m256i a, __m256i b)
  ///   VPMAXSD ymm, ymm, ymm/m256
  /// </summary>
  public static Vector256<int> Max(Vector256<int> left, Vector256<int> right);
}
Here is a pretty table summarizing the findings:
| Function | Intrinsic | Instruction |
|---|---|---|
| SetAllVector256 | _mm256_set1_epi32 | VPBROADCASTD |
| LoadVector256 | _mm256_loadu_si256 | VMOVDQU |
| Store | _mm256_storeu_si256 | VMOVDQU |
| Max | _mm256_max_epi32 | VPMAXSD |
Now that we know what should we expect from the JIT, we are ready to analyze the disassembly.
Visual Studio
Let’s start with the easiest way. Most .NET programmers work on Windows, and probably have the Visual Studio 2017 installed. Viewing the disassembly in Visual Studio is super simple—just place a breakpoint anywhere in your code and select Debug > Windows > Disassembly after reaching it. You will see the window looking something like this:
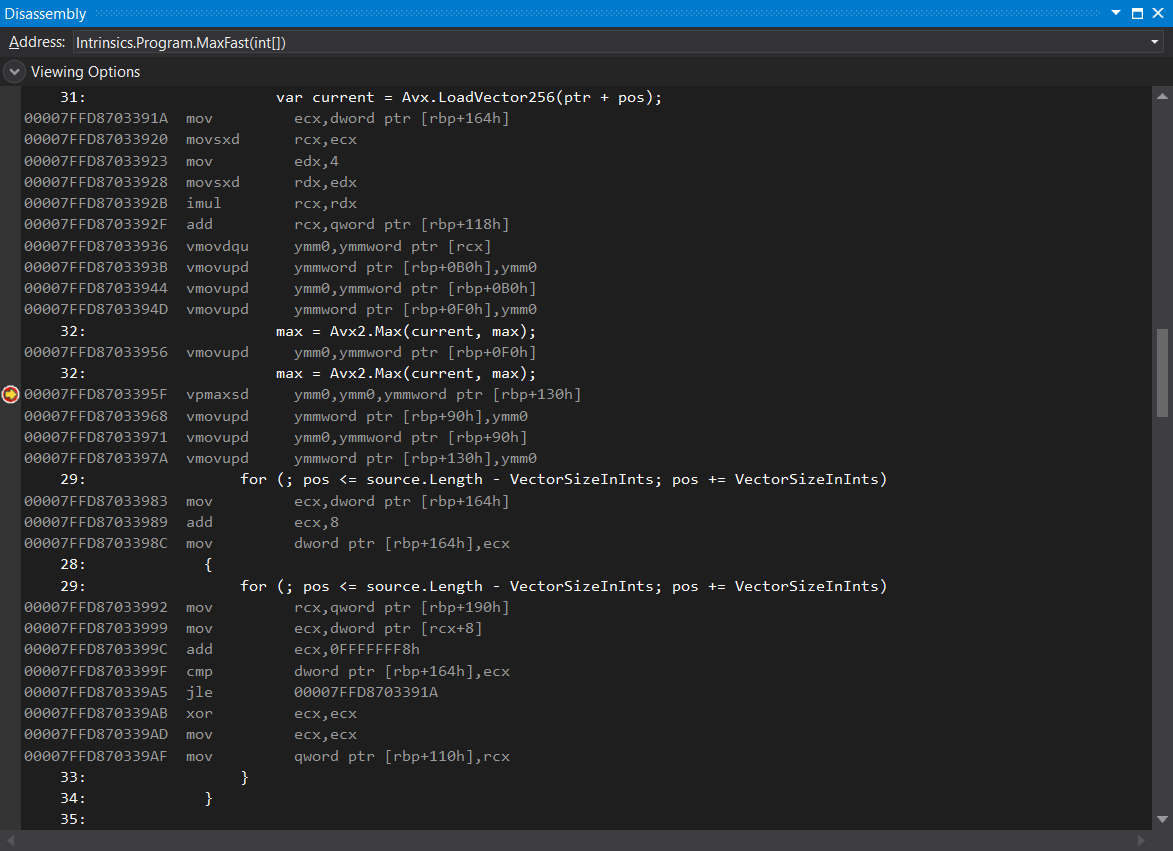
The good news is that VPBROADCASTD, VMOVDQU, and VPMAXSD are all present, which means that the JIT is doing its job correctly. The bad news is that there is too much copying of data between the registers and the stack (see all these VMOVUPD instructions). Why is that happening?
We usually want to see the values of all variables and fields during our debugging sessions, and vector types are no exception. Indeed, if you place your mouse over any vector variable in the MaxFast function (e.g. max or current) you will see the values present in the vector. In other words, we are getting a better debugging experience at the price of a suboptimal assembly code. But shouldn’t JIT’s priority be to generate the optimized code, since we are running in the release mode?
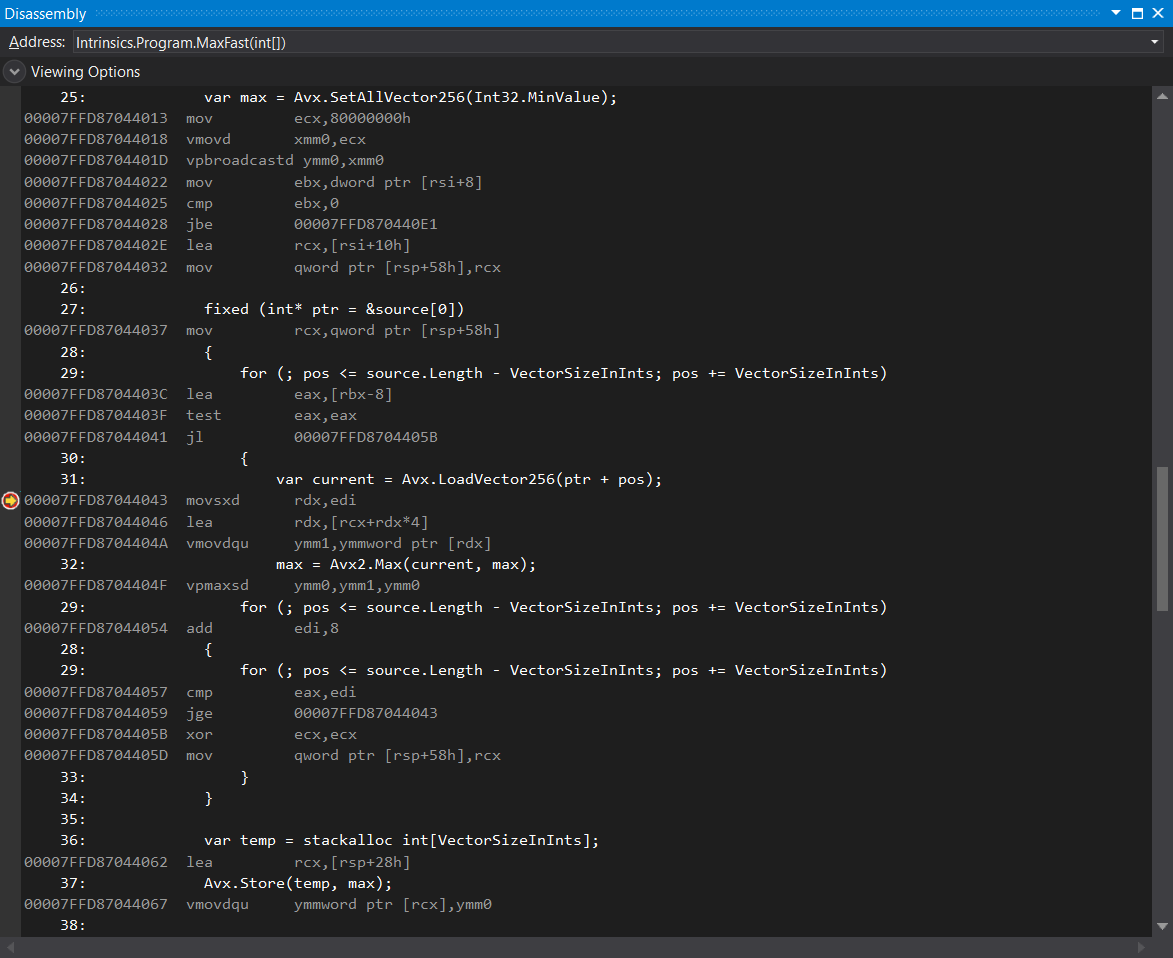
Whenever you launch your program from Visual Studio with the debugger attached, the JIT will create debug code, even if you are running in the release mode. To prevent that, you have go to Tools > Options > Debugging > General and uncheck the Suppress JIT optimization on module load option. After doing that, the JIT will start generating the optimized code, without redundant instructions:
WinDbg
WinDbg includes the most powerful .NET debugger available on Windows. Unfortunately, it’s not very user-friendly (WinDbg Preview is more aesthetically pleasing, but that’s all—beneath the modern looks is still the same program). Despite that, it’s relatively easy to see the disassembly of any managed method by using just a few commands.
First, I’m going to put a breakpoint in my code, after the call to MaxFast function, because I’m lazy and don’t want to learn more WinDbg commands than absolutely necessary. Placing the breakpoint after our function guarantees that the JIT has finished generating the code for it. The main program now looks like this:
public static void Main(string[] args)
{
  const int count = 1000;

  var ints = Enumerable.Range(0, count).ToArray();
  var max = MaxFast(ints);

  Debugger.Break();
  Console.WriteLine(max);
}
We are now ready for our debugging session. WinDbg will break immediately after running the program. Type g or press F5 to continue execution. After WinDbg breaks at our custom breakpoint, type the following two commands:
.loadby sos coreclr
!name2ee Intrinsics!Program.MaxFast
The first will load the SOS Debugging Extension, enabling WinDbg managed debugging features. The seconds one will show us all the interesting information about our method, including the memory address of the jitted code:
Module:      00007ffd87e94520
Assembly:    Intrinsics.dll
Token:       0000000006000002
MethodDesc:  00007ffd87e954c0
Name:        Intrinsics.Program.MaxFast(Int32[])
JITTED Code Address: 00007ffd87fb3ff0
You can click on the JITTED Code Address value (00007ffd87fb3ff0 in the listing above). You will be presented with the window containing almost the same information that we previously saw in Visual Studio (including line numbers):
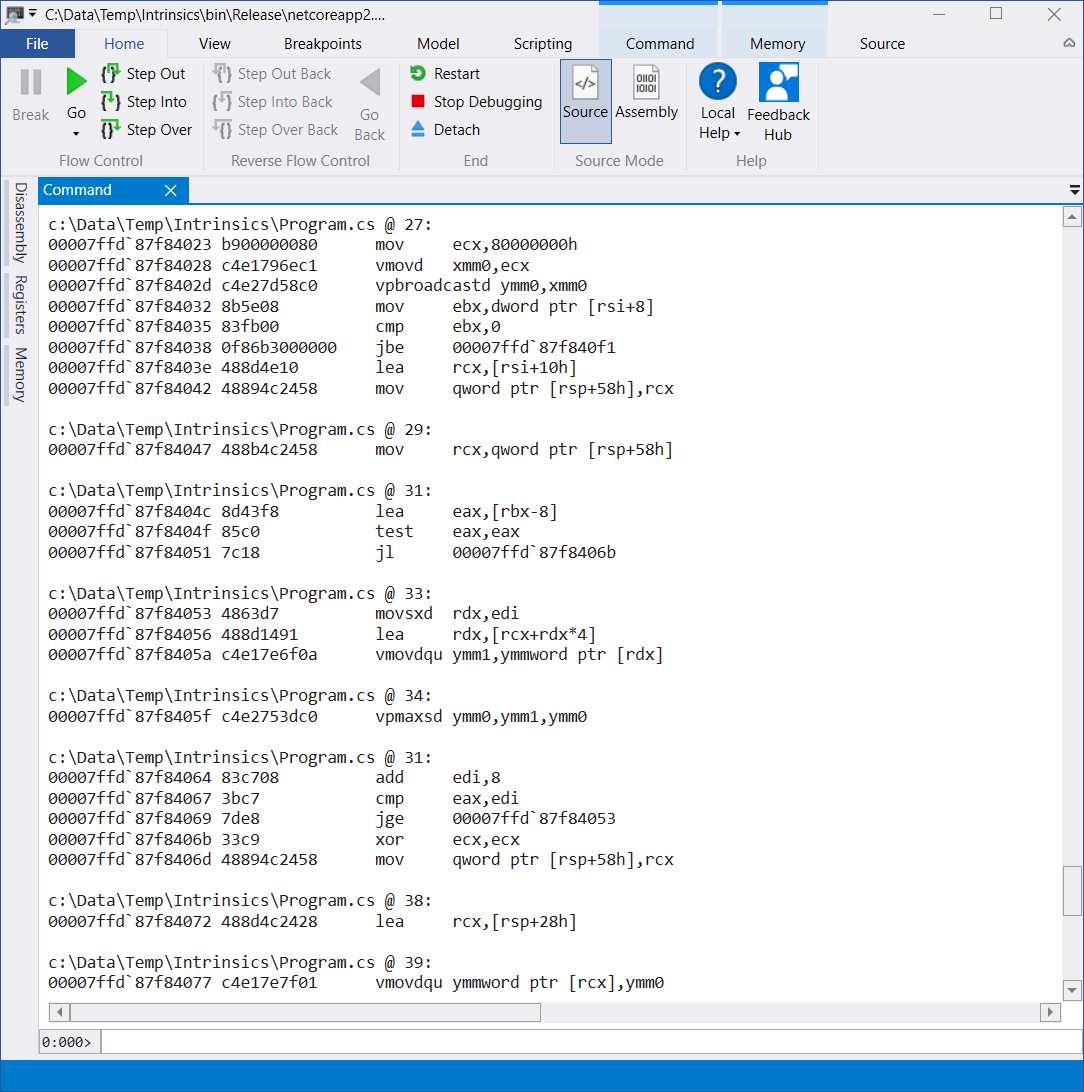
I hope this was not too painful! If this quick WinDbg walkthrough was not clear enough, you can find the detailed tutorial on using it with the .NET Core in this great post.
BenchmarkDotNet
BenchmarkDotNet has become an indispensable library in the every .NET programmer’s toolbox. It’s mostly used to diagnose CPU and memory performance problems, but it’s also capable of disassembling the .NET code with the help of Disassembly Diagnoser. Viewing the assembly code of any method is as simple as adding the DisassemblyDiagnoser attribute to your benchmark class:
[DisassemblyDiagnoser(printAsm: true, printSource: true)]
[RyuJitX64Job]
public class IntrinsicsBenchmark
{
  private readonly int[] ints = Enumerable.Range(0, 1000).ToArray();

  [Benchmark]
  public int MaxFast()
  {
    return Program.MaxFast(ints);
  }
}
This benchmark will produce the standard BenchmarkDotNet output, but you will also get an additional HTML file looking like this:
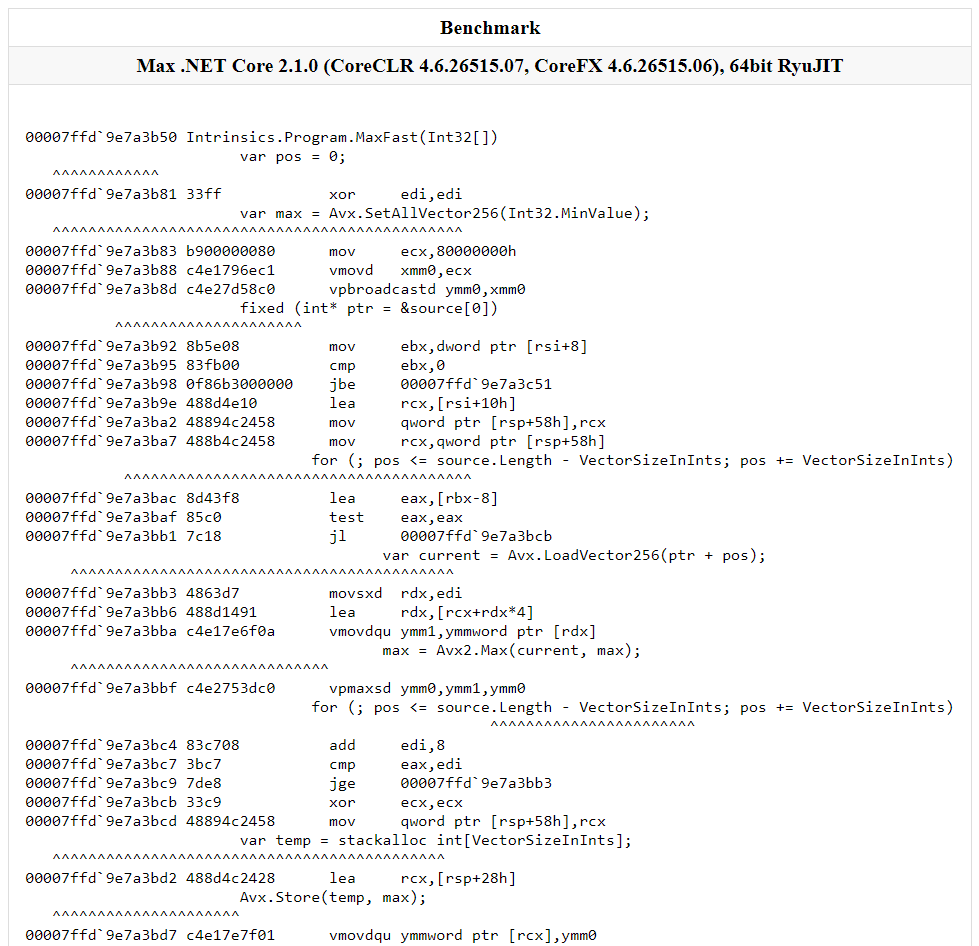
This may be the easiest way to view the code generated by the JIT, since if you are using platform intrinsics, you are probably measuring the performance of your program. The only downside to this approach is that it’s available only on Windows (the same applies to Visual Studio and WinDbg, though).
CoreCLR
As you can see, Windows developers are in much better position regarding the .NET Core tooling—all of the options for viewing the assembly generated by the JIT that I described so far work only on Windows. If you are a developer working on Linux or Mac, you will have to use the nuclear option: building the CoreCLR from scratch.
Building the CoreCLR is not as intimidating as it may sound. You can find the detailed instructions on how to do it for each supported platform here:
If you have all available prerequisites, it basically boils down
to just running the build.sh (or build.bat) script from
the directory of cloned CoreCLR repository. We are going to
need both debug and release builds:
./build.sh debug skiptests
./build.sh release skiptests
Build output will be available in the coreclr/bin/Product
directory. For example, on OS X you will have these two
folders:
coreclr/bin/Product/OSX.x64.Debug
coreclr/bin/Product/OSX.x64.Release
The next step is to determine the runtime identifier of the platform you are running on, and to add it to your project file. On OS X it will look like this:
<RuntimeIdentifier>osx-x64</RuntimeIdentifier>
Some other examples of runtime identifiers are debian-x64 for Debian, and win10-x64 for Windows 10 (the complete list is available here).
Now you can build your application by running the following command:
dotnet publish -c release
All that is left is to copy the files from the CoreCLR release
build directory to your application’s publish directory (for
example, bin/Release/netcoreapp2.1/osx-x64/publish), and
then copy the debug version of clrjit.dll to the same place.
You are now ready to examine the JIT’s output! One more step before doing that is to set the COMPlus_JitDisasm environment variable to the name of the function whose disassembly you want to see:
# Linux or OS X
export COMPlus_JitDump=MaxFast

# Windows
set COMPlus_JitDump=MaxFast
You may also want to set the value of COMPlus_JitDiffableDasm environment variable to 1 in order to ignore values that change between runs (e.g. pointer values).
After configuring all the variables, run the application using the dotnet command. You will see the following output:
G_M64227_IG02:
       mov      rsi, rcx
       xor      edi, edi
       mov      ecx, 0xD1FFAB1E
       vmovd    xmm0, ecx
       vpbroadcastd ymm0, ymm0
       mov      ebx, dword ptr [rsi+8]
       cmp      ebx, 0
       jbe      G_M64227_IG11
       lea      rcx, bword ptr [rsi+16]
       mov      bword ptr [rsp+58H], rcx
       mov      rcx, bword ptr [rsp+58H]
       lea      eax, [rbx-8]
       test     eax, eax
       jl       SHORT G_M64227_IG04

G_M64227_IG03:
       movsxd   rdx, edi
       lea      rdx, [rcx+4*rdx]
       vmovdqu  ymm1, ymmword ptr[rdx]
       vpmaxsd  ymm0, ymm1, ymm0
       add      edi, 8
       cmp      eax, edi
       jge      SHORT G_M64227_IG03

G_M64227_IG04:
       xor      rcx, rcx
       mov      bword ptr [rsp+58H], rcx
       lea      rcx, bword ptr [rsp+28H]
       vmovdqu  ymmword ptr[rcx], ymm0
It’s not as user-friendly as Visual Studio, WinDbg, or BenchmarkDotNet, but it has all the information you need, especially if you already know what are you looking for.
If you had problems following the instructions in this section, you can find much more detailed explanation in the Viewing JIT Dumps page on GitHub.
Conclusion
That’s all for today! In the next post we will explore several important techniques that can help you squeeze every bit of performance out of your SIMD code.